Microwave spectroscopy has traditionally been used to determine the structures of small molecules accurately. Only gaseous molecules or liquids and solids with finite vapour pressure could be studied. Hence, unlike spectrometers in other region of the electromagnetic spectrum, microwave spectrometers did not become very popular. Commercial microwave spectrometers were available during the 60s and 70s and slowly they disappeared. Development of the pulsed nozzle Fourier transform microwave spectrometer by Balle and Flygare, expanded the scope of microwave spectroscopy significantly. This spectrometer turned out to be almost ideal as it had very high sensitivity and resolution, simultaneously. With this, one could look at weakly bound complexes formed between virtually any two chemicals, be they atoms, molecules, radicals or ions. Several laboratories around the world have built such a spectrometer, mainly in the last decade or so. This spectrometer is primarily a research equipment and hence is not commercially available. Recently, our laboratory has fabricated the PNFTMW spectrometer and this paper describes the details.
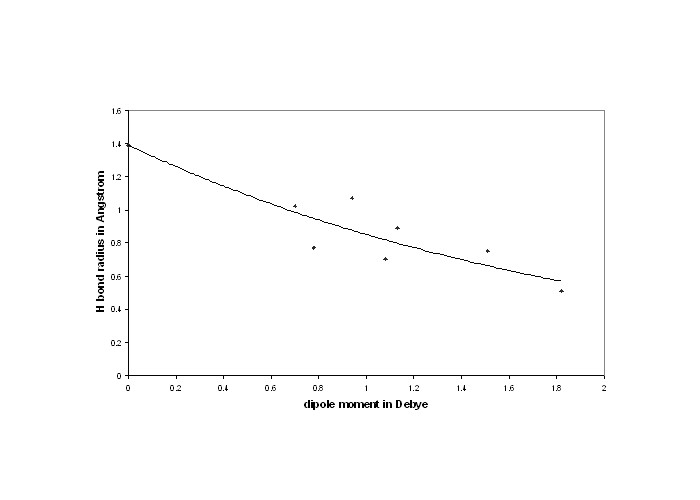
The PNFTMW spectrometer has enabled the accurate determination of the equilibrium structures of many different intermolecular complexes, bound by H bonding or van der Waals interaction. Locating the H atom in molecules and complexes is very difficult irrespective of the technique used, such as X-ray diffraction or rotational spectroscopy. However, with the sensitivity and resolution of PNFTMW spectrometer, small hyperfine interactions due to quadrupole coupling, spin-spin interactions etc could be well resolved. The hyperfine coupling constants observed in complexes provide independent structural data, which can refine/restrict the structure obtained from rotational constants. This has led to a wealth of accurate structural data for a large number of HX complexes. After a detailed analysis of these data, we have defined 'hydrogen bond radii' for the hydrogen halides (HF, HCl, HBr and HI) The B---HY distances (rH) in these complexes could be interpreted as the sum of the 'hydrogen bond radius' of HY and the rESPM, of B, which is the distance from the bonding center in B to the minimum in the electrostatic potential. This analysis was extended to the complexes containing H2O and C2H2 to determine the hydrogen bond radii for CH and OH groups. Hydrogen bonds formed by OH and CH groups are prevalent in biological systems. The 'h bond radius' of H2O and C2H2 could be used as an indicator of H bonds in biological systems.


INTRODUCTION
II. DESIGN AND PERFORMANCE OF THE SPECTROMETER
The pulsed nozzle Fourier transform microwave spectrometer combines the supersonic expansion technique with the cavity Fourier transform microwave spectrometer. It has several components: i) a Fabry-Perot cavity made of two highly polished Aluminium mirrors (surface roughness better than microns) one of which is movable; ii) supersonic nozzle source for producing a cold jet/beam of molecules; iii) high vacuum chamber pumped by a 20" diffusion pump housing both i and ii; iv) microwave electrical circuit for polarizing the molecules and for detecting the molecular emission. The complete design of the spectrometer is described below in two parts as mechanical and electrical.
(a) Mechanical design
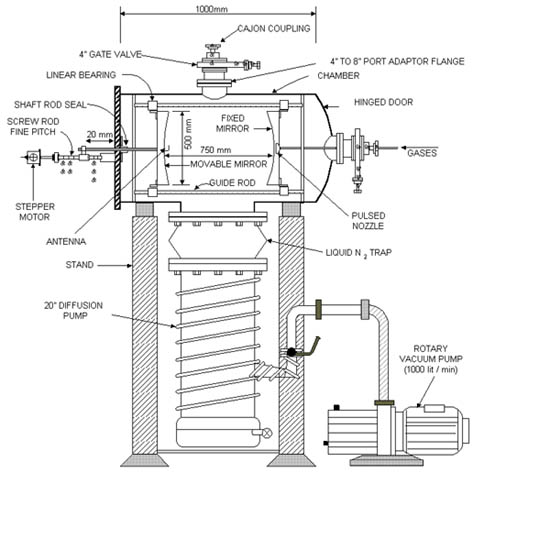
The mechanical design of the vacuum chamber housing the Fabry-Perot cavity is shown in Figure 1. It is a cylindrical chamber made of stainless steel, SS 304. It is 1000 mm long and the diameter is 850 mm. The chamber is directly seated on top of the 20" diffusion pump (Vacuum Techniques, Bangalore, India). The pumping speed of the diffusion pump is = 10,000 l s-1 and it is backed by a 1000 l m -1 belt-less rotary mechanical pump. The chamber can be evacuated to 10-6 Torr and a liquid nitrogen trap improves the pumping below 10 -5 Torr. The diffusion pump is water-cooled and a closed circuit water circulation facility includes a cooling tower to keep the water at room temperature. Inside the chamber, two spherical aluminium mirrors have been mounted co-axially on 3 SS guide rods. The mirrors were made from 65 mm thick Aluminium disks with a diameter of 500 mm. The radius of curvature of both the mirrors is 800 mm and CNC machining ensured that the surface roughness and the radius were good to 1 micron. The distance between the mirrors could be varied in microns between 650 - 750 mm. We have opted for a large mirror, so that the low frequency cutoff for the spectrometer is about 3.8 GHz. The radius of the mirror (a) and its radius of curvature (R) determine the lower frequency at which the Fresnel number is unity
a2/R λ = 1 .......(1)
Several laboratories have smaller mirrors with a low frequency cutoff near 8 GHz and the frequency range of such spectrometers are typically 6-18 GHz. The lower frequency limit is important, if one is interested in looking at larger clusters, which would have many low J transitions below 4 GHz. The Fabry-Perot cavity has been tested between 2-26 GHz in our spectrometer.
The movable mirror is fixed with a micrometer controlled fine pitch screw rod and it is driven by a synchronized stepper motor (Sanyo Denki, Japan). The stepper motor driver is controlled by the PC. The linear screw rod has a pitch of 5 mm which means that the linear distance covered by the mirror for a 360� rotation is 5 mm. The stepper motor, in high-resolution mode, takes 4000 steps for a complete rotation and thus the mirror moves in steps of 1.25 µ m.
A coaxial cable runs through the supporting rod for the mirror with a SMA female connector at the mirror end. This cable has a hermetically sealed SMA connector at the other end so that the mw power can be coupled in and out of the cavity at vacuum. The SMA connector goes through a small hole at the center of the mirror and an antenna (L-shaped bent wire made from the central wire of the coaxial cable) can be placed at the connector. The other mirror has a10 mm hole at the center as well. In addition, the backside of this mirror
has a 25 mm cylinder carved out so that a pulsed nozzle (General Valve, Series 9) could be placed. The pulsed valve goes through a 4" gate valve and an O' ring seal. This assembly could also be connected at the top of the chamber through another 4" gate valve.
A four-channel mass flow controller/reader (MKS Instruments, 647B) and four different mass flow meters (1179A) are used for preparing the gaseous mixture on the fly. Two of them are used for the carrier gases (either Helium or Argon) and their range is 0 - 1000 SCCM calibrated for N2. The other two are used for reagent gas(es) flow and they have a range of 0-20 SCCM. The output from all the four flow meters are mixed and taken to the pulsed valve. The reagent flow meters are connected to 3-way valves in order to handle gases and liquids. The gaseous reagents are directly flown to the mixer and for liquids, the carrier gas is bubbled through a glass reservoir containing the liquid. The 3-way valves could be selected either for direct flow or through the liquid bubbler. The pulsed valve feed through has a 3-way valve as well so that the excess gases can be pumped out with a separate mechanical pump. This bleed line goes through a needle valve to control the outflow so that the back pressure at the nozzle could be maintained at the required level (typically 1-2 atm.).
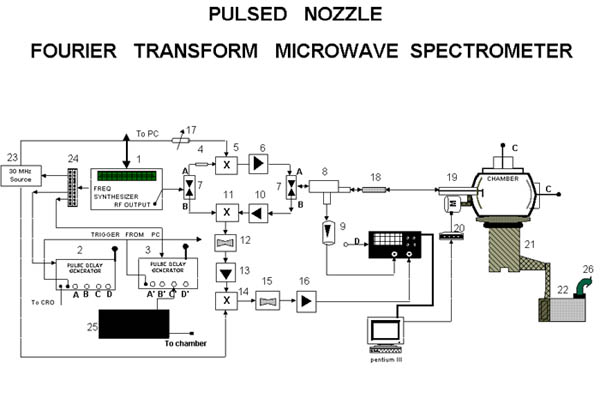
fig2
(b) Electrical design
The microwave/rf circuit used for polarization and detection of the molecules/complexes is shown in Figure 2. The microwave source is a frequency synthesizer (#1 in Figure 2, HP 83630L, 13 dBm power) which can generate any frequency between 10 MHz and 26.5 GHz to 1 Hz accuracy. The output from the synthesizer (at v) is routed to a single pole double throw (SPDT) switch (#7, Sierra Microwave Technology, SFD0526-001, Isolation 60 dB), which powers either a single side band generator (#5 Miteq, SM-0226-LC1A) or an image rejection mixer (#11 Miteq, IR-0226-LC1A). The SSBM mixes the synthesizer output at v with a synchronous 30 MHz signal (Stanford Research Systems DS345) and generates v+30 MHz signal. This signal is amplified by a medium power
amplifier (#6, Miteq, JS3-02002600-5-7A) with a gain of 24 dB. The amplified signal goes through another SPDT switch (similar to #7). Both switches work synchronously connecting the polarization and detection parts (top and bottom of the SPDT switches in the Figure 2), alternatively. During the polarization pulse, the SPDT output goes through a directional coupler (#8, Narda, 4227-16) and a DC block (#18, HP 11742 A) to the antenna inside the chamber.
The same antenna couples the molecular signal back to the detection circuit. During the polarization pulse, if the Fabry-Perot cavity is not tuned to the particular frequency v+30 MHz, most of the mw power is reflected. The directional coupler routes 2.5 % of this reflected signal to the oscilloscope (#27, Tektronix, TDS 430A) via a diode detector (#9, Narda, 4507). The moving mirror is moved in steps of micron until the reflected power shows a dip in the scope. The resonant frequencies, v, of the Fabry-Perot resonator for the TEMmnq modes are
v = c/2d [(q+1) + (1/p)(m+n+1) cos-1(d/R)] (2)
Thus, within the maximum variation of the distance between the mirrors (100 mm), several resonances can be observed for a given frequency. Most of the laboratories having a PNFTMW spectrometer employ 2 antennas, one in each mirror, for tuning and detection. This leads to an inherent reduction in the detected signal. Using the directional coupler with only one antenna is more advantageous. Only 2.5 % of the signal are used for tuning purpose instead of almost half the signal
The microwave pulse length of = 1 µ s leads to a frequency width of about 1 MHz and if there is an allowed transition within this bandwidth for the molecules/complexes in the cavity, polarization occurs. The polarized molecules emit a free induction decay (FID) at a frequency v+30�δ , which lasts for a few 100 ms. This signal is amplified by a low noise amplifier (#10, Miteq JS4-02002600-3-5P, noise 2.8 dB, gain 28 dB) and mixed with the synthesizer signal at v in an image rejection mixer (#11, Miteq, IRO-0226-LC1A). The IRM gives only the 30�δ signal which passes through a band pass filter (#12, Minicircuits BBP 30) and a low noise amplifier (#13, Minicircuits, ZFL-500LN). The 30�&delta signal is down converted to δ by the rf mixer (#14, Minicircuits ZAD-1) and a low pass filter (#15, Minicircuits, BLP-5). This signal is amplified and digitized by the oscilloscope. The 30 MHz signal is from the function generator (#23, SRS DS345) and so we have the option of varying the intermediate frequency (IF) in the mixer.
All the microwave components used in our setup are ultra-wide band. The original spectrometer could be operated only in octave bandwidths and several switches were used for going from one band to another. In some cases, the components needed to be physically changed for going from one band to another. All the recently built PNFTMW spectrometers use one set of components that perform reasonably well throughout the frequency range. Our spectrometer can be operated from 2-26 GHz without changing any components.
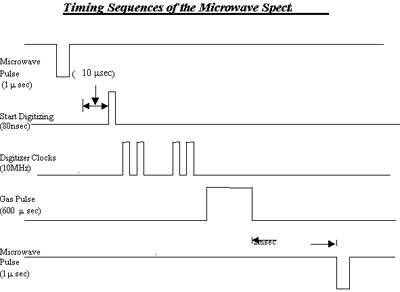
fig 3
This is an experiment of pulses with both the molecular sample and the microwave source being pulsed. Two delay generators (# 2 and 3, SRS, DG535) generate all the timing sequence (shown in Figure 3) needed for the experiment. The sequence is described below with typical pulse lengths and delays. First a microwave pulse is applied to the evacuated chamber and the background response from the chamber is digitized. This includes random noise as well as coherent ringing from the cavity. The ringing typically lasts for a few microseconds. The digitizer is triggered after a delay to avoid the ringing. The pulsed nozzle is opened for 600 µ s. After a delay of 1 ms for the molecules to reach the center of the cavity, the microwave pulse is applied again. The response from the molecules is digitized now and subtracted from the background collected earlier. Fourier transformation of the time domain signal gives the frequency domain spectrum. The experiment can be repeated for N number of gas pulsed to improve the signal-to-noise ratio. Moreover, the molecules stay in the cavity for 1-2 ms and it is possible to apply several microwave pulses per gas pulse. The spectrometer operation is fully automated. Labwindows CVI (National Instruments) software offers the backbone using which the software has been developed. The code is written in C. The MW synthesizer, oscilloscope and the delay generators are controlled by a GPIB (NI) interface. The stepper motor driver is controlled by the parallel port, which also sends the starting trigger for the experiments. The time domain signal from the scope is transferred to the PC for averaging and Fourier transformation.
Applications of Fourier transform microwave spectroscopy. : -
Perhaps the most important concept in chemistry is that of a chemical bond, which describes the interaction between atoms in a molecule. While the chemical bond in molecules is reasonably well understood today, the nature of the intermolecular interaction is still in debate. Intermolecular interactions are important in understanding the properties of condensed matter with applications in physics, chemistry, materials science and biology. Understanding intermolecular interaction requires that the intermolecular potentials be determined experimentally. The first step in doing that is to find the structural parameters of the global minimum in the intermolecular potential.
Rotational spectroscopy has been an extremely valuable technique for structure determination of stable molecules in the gas phase. When Balle and Flygare developed the pulsed nozzle Fourier transform microwave (PNFTMW) spectrometer in the1980s, rotational spectroscopic studies could be extended to weakly bound complexes made of atoms and molecules. These complexes are bound by H bonds or van der Waals forces. Further advances have made it possible to study the rotational spectra of radicals/ions or complexes made of atoms/molecules/radicals/ions. Such studies are important in understanding the interaction between these species. We plan to build a PNFTMW spectrometer here, which will be the first in India.
Most of the weakly bound complexes studied so far could be classified as H bonded or van der Waals complexes. One central question in this field is : Is H bonding unique? There have been arguments for and against H bonding being unique. One clear answer to this question would be to form a complex that is bound by some other atom, Li being the natural choice. Lithium bond has been postulated in 1970 by Allen and coworkers and theoretical work on Li bonds have been continued ever since. So far, no definitive experimental evidence has been found. With the PNFTMW spectrometer, Li bonded complexes could be formed and studied.
Atmospheric and interstellar species emit microwave radiation and so far over a 100 such species have been identified. Still, many of the emitted lines are unassigned. In all such assignments, it is important to form these species in the laboratories and obtain the microwave spectrum. The PNFTMW spectrometer can be very valuable in this effort as well.